Check Inductors Quickly With a PIC-Based Meter That Also Measures Frequency
After doing the same thing many times, I’ll sometimes stop and ask myself why I’m doing it that way. A while back, I designed some DC-DC converters, so I wound and measured a lot of inductors. Each time, I soldered a 5,000 pF 1% mica capacitor across the inductor. Then I hooked up a signal generator and checked the combination’s resonant frequency on an oscilloscope. Five seconds on my HP-11C calculator gave me the inductance.
Was there a simpler solution? My existing procedure couldn’t be easily automated, but there was an alternative. I could plug an unknown inductor into an LC oscillator and measure the resulting frequency. I’d have to design an oscillator that would work with a wide range of inductors and devise something to measure the frequency and display the corresponding inductance.
The latter was no problem. Small PIC microcontrollers can be programmed to measure and display frequencies to tens of MHz. Knowing the tuning capacitance, a PIC could easily calculate and display the inductance. Put a wide-range oscillator in front and I’d have a handy device that would measure both inductance and frequency.
Which Oscillator?
As this circuit must work with almost any inductor, I chose a Colpitts oscillator. This resonates an untapped inductor with two capacitors in series and uses an emitter-follower as its amplifying device. The slight voltage step-up provided by the capacitors balances the below-unity gain of the emitter-follower.
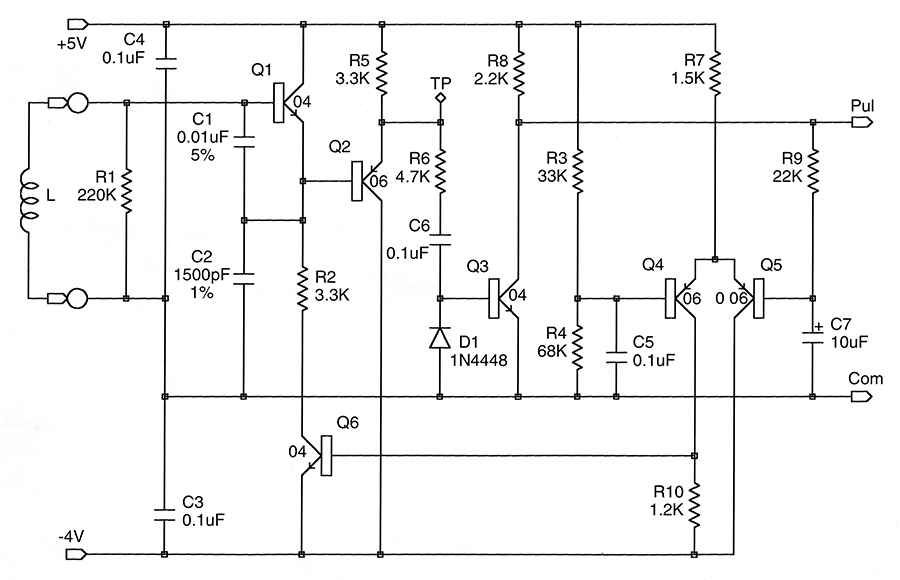
Figure 1. This oscillator, with its output buffer and gain control circuit, runs well with almost any inductor.
In Figure 1, C1 and C2 are the tuning capacitors and Q1 is the emitter-follower. (All NPN transistors are type 2N3904, PNP transistors are 2N3906s. Close equivalents will suffice in both cases.) The rest of the circuit provides a sine and a pulse output and maintains a constant oscillation level.
This configuration has a number of nice features. Not only are both the inductor and the critical tuning capacitor grounded on one side, but the larger capacitor swamps the effect of the transistor’s highly variable base-emitter capacitance. The transistor’s collector-base capacitance can be ignored.
The oscillation frequency is inversely proportional to the square root of the inductor value. Thus, a 10,000:1 range of inductance can be measured with only a 1:100 range in frequency. This meter measures inductors from 3.3 µH to 100 mH.
The Critical Capacitor
The tuning capacitance has to be large enough to swamp the inductor’s self-capacitance and any strays introduced by the user’s hand holding it in place. The resulting, relatively low operating frequency reduces the effect of core losses and the skin effect. On the other hand, if the oscillation frequency is too low, the circuit Q could become too low for the oscillator to run at all. I chose 1,300 pF (C2 = 1,500 pF) as a good compromise. This gives oscillation frequencies between 12 kHz and 1.4 MHz.
The accuracy of the inductance measurement depends directly on the precision of capacitor C2. Since C1 is much larger than C2, its accuracy has less effect. I had several 1% capacitors in my junk box and assumed that such parts were readily available. While capacitor manufacturers offer them, my usual distributors don’t stock capacitors with better than 2% accuracy. You may have to settle for one of those. Only mica or plastic foil capacitors should be used for C1 and C2. Ceramic capacitors tend not to have close tolerances and often vary considerably with temperature.
Setting the Level
I wanted a constant output voltage for any inductor, so I added automatic gain control. This adjusts the DC current through Q1 over a 10-1,000 µA range to generate a two-volt peak-to-peak sinusoidal output at the test point TP. This sine output, buffered by Q2, makes this oscillator a useful signal source for other purposes. Q3 converts the sine wave into pulses to drive the frequency meter.
Over the entire inductance range, the working impedance of the oscillator ranges from about 80 ohms to 8,000 ohms. To achieve a two-volt peak-to-peak output with a low-Q, 10 µH inductor requires a drive around 1.2 mA. At the other end of the scale, a high-Q, 100 mH inductor should generate a two-volt signal with only 1.2 µA drive. (The 20 uA or so of Q2’s base current confuses things a little.)
The oscillator drive current comes from transistor Q6 whose base is driven by a voltage source. The collector current of Q6 is an exponential function of its base-emitter voltage which, in its turn, is proportional to the difference between the desired output amplitude and a fixed reference. R2 prevents Q1 from drawing a huge current when no inductor is being tested. R1 not only defines the open-circuit base voltage of Q1, it sets a limit to the circuit Q when measuring large inductors. Q4 and Q5 compare the DC level of the output pulses with a reference voltage derived from R3 and R4.
The feedback loop has two rather desirable side-effects. One is that whatever the current in Q1, the output amplitude is a fixed function of the control voltage. This makes stabilizing the control loop much easier. In a linear circuit, the loop gain would change from one end of the range to the other.
The other side-effect is the loop’s independence of temperature. A transistor’s exponential characteristic is very sensitive to the operating temperature; normally, you need extra transistors to compensate for this. When everything’s inside an amplitude feedback loop, the loop compensates for temperature, as well. (The ambient temperature changes the threshold of Q3, producing a slight amplitude variation with temperature.) Within reasonable limits, the battery voltage has no effect.
The lowest oscillator frequency is about 12 kHz. With a high-Q inductor, the response to drive changes could be quite slow and, for a stable loop, the feedback has to be even slower. I was tempted to design a clever second-order loop but settled for a slow first-order one. That’s why C7 is comparatively large. As it takes a significant fraction of a second to measure an inductor, we don’t need a super-fast control loop.
Does it Work?
Actually, rather well. Having designed for a maximum frequency of about 1.4 MHz, I was a bit surprised to find the oscillator ran with much smaller inductors than the 10 µH I’d intended. The limit is about 0.47 µH, but by then the oscillator is running at 6 MHz and the TTL pulse converter is no longer doing its job. The PIC firmware allows inductance measurement down to 3.3 µH. At the LF end, the sine output at 12 kHz is a little warped but things work well enough. The display format cuts measurement off at 99.9 mH.
You Can Count on a PIC
I like to stick with old and trusted parts, so I used a 16C54 for this job. Any of the 18-pin 16C5x series chips will work (see the Picking a PIC sidebar). Given a large enough internal prescaler ratio, the PIC’s timer input can count frequencies approaching 50 MHz without missing a beat. The timer register and two overflow registers accumulate the input pulses for a firmware selected period. The number of pulses counted indicates the frequency. This frequency can be displayed as-is or converted into an inductance. The result is sent to a 16-character liquid crystal display (LCD).
For the PIC’s clock, I used the popular 6.144 MHz crystal frequency. This gives a nominal maximum timer input of 1.45 MHz, but using the PIC’s internal prescaler with its minimum division ratio (2) doubles this to 2.90 MHz. Without prescaling, the timer pin requires a roughly equal on/off pulse input. With the prescaler in-circuit, any pulse over 10 nS gets counted. As the oscillator generates short pulses, prescaling is a good idea.
Picking A PIC
The Microchip PIC16C5x series of low-level microcontrollers come in 18 and 28 pin packages and offer a range of both program (EPROM) memory and register (RAM) memory. They are available in erasable versions having a ceramic package with a UV transparent window and in one-time-programmable (OTP) plastic packages that can only be programmed once. For amateurs, the ability of the windowed parts to be erased and reprogrammed far outweighs their higher price-tag. The UV erasable part is 16C54C/JW.
Recent 16C5x revisions are not only cheaper, they run twice as fast as their predecessors, up to 40 MHz rather than the original 20 MHz. This project needs just less than the minimum available code and register space, so even the humblest of 16C54 chips will do the job. It won’t hurt to use a 16C56 or 16C58 and the revision level doesn’t matter. This is a great way to reuse any old, slow PICs you have lying around.
The PIC must be programmed with the code LMETER.OBJ (INHX8M format) which is available from the downloads section below.
A Free Frequency Meter
The inductance meter in Figure 2 measures the oscillator frequency and displays the corresponding inductance about three times a second. In frequency meter mode, selected by a slide switch, a TTL level input frequency is counted for two seconds and displayed with 1 Hz resolution from 0.000 to 999.999 kHz. In both modes, a carefully counted number of instructions is executed between the start and finish of input sampling.
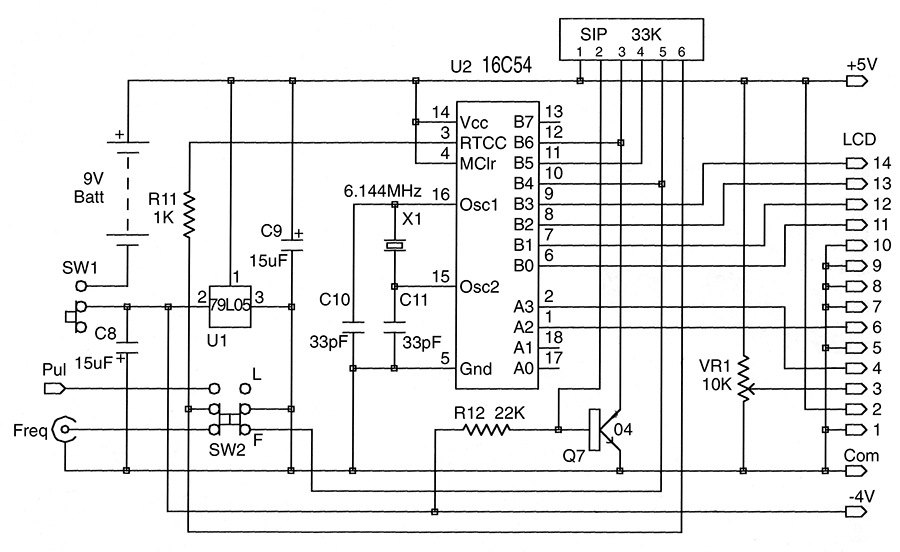
Figure 2. The display driver uses a PIC microcontroller programmed to measure and display both frequency and inductance. It drives a cheap LCD with the result.
Don’t take more than the first four frequency digits too seriously. The crystal frequency depends on the values of C10 and C11, among other things, and can be in error by one part in 5,000 or so. If you don’t need an inductance meter, you can use the PIC plus an LCD as a compact 1 MHz frequency meter. Of course, if you only want an inductance meter, you can leave out the BNC connector and the L/F switch.
Self-ranging
When measuring inductance, the input frequency lies somewhere in a 100:1 range. Using a short counting period would result in loss of resolution at the low end of the range, while a longer period would lead to a total count greater than two bytes. I compromised by dividing the frequency range into high and low decades. The easiest way to achieve this was to use two counting periods, 40 mS and 400 mS. If the 40 mS count is greater than 2,765, it’s processed as-is. Otherwise, a 400 mS count is done and a factor of 100 is incorporated into the inductance display.
Counting Loops
The timing loop has to perform two tasks: to keep track of how many instructions have been executed and to look for overflows from the PIC’s timer register, RTCC. With a times-two prescaler, the RTCC register overflows every 512 input pulses. We must read it more often than that and increment a carry register any time RTCC shows a decrease from its last state, that is, if an overflow has taken place. The sampling and updating loop executes once per 256 instructions and repeats every 166.7 µS.
A further counting loop executes 60 of these 256 instruction sampling cycles and thus repeats every 10 mS. Its loop counter is preset to 4, 40, or 200 to give 40 mS, 400 mS, or 2 S periods.
When nesting loops this way, put several NOPs at the start of the inner loop. After N times around the inner loop, it’s time to decrement the outer loop, to reload N, and start the inner loop cycling again. This takes five or so extra instructions. You play catch-up by jumping into the inner loop below the NOPs, making the first cycle shorter than a regular one.
Computing the Answer
Commercial inductors generally have 10% tolerances. Except when comparing matched inductors, there’s little point in making very accurate measurements. A three-digit indication in mH or µH units is perfectly adequate. The nominal range is from 10.0 µH to 99.9 mH. The display indicates when the inductor is too high or too low to measure.
To convert a frequency to an inductance, a three-byte calibration constant is divided by the frequency and the result is squared. This is then converted to decimal form for the display. This process has to work on numbers from 3,000 to 30,000 without overflowing or losing resolution.
The constant is multiplied by 256 before being divided by the 16-bit count. The 16-bit result is squared, giving a 32-bit number whose lower two bytes are ignored. This corresponds to the inductance in units of 0.1 µH or 0.01 mH, depending on the range. This is converted into a four-digit BCD string whose first three non-zero digits drive the display. Luckily, 32 by 16 bit division, 16 by 16 multiplication, and BCD conversion are library functions I’ve used many times.
Powering It
This oscillator (and some LCDs) requires a negative power rail. A negative three-terminal regulator derives both positive and negative supplies from a nine-volt battery. The positive (+5 V) rail that drives the PIC is the battery’s positive terminal. Its negative terminal supplies about -4 V to the oscillator. For convenience, I used a 79L05 regulator. This has the disadvantage of 3 mA stand-by current. You can save some battery power by substituting a low-power negative regulator for the 79L05. The battery consumption is about 7.5 mA, so you can expect a battery life in the 50 to 100 hour region.
One PIC port acts as a go/no-go battery voltage sensor. A “Battery Low” message is displayed when the battery voltage — about 7.5 V — is too low to maintain a regulated five-volt supply.
Packing it In
One has the usual options. Shoe-horn everything into the minimum plastic case possible or use a bigger box that takes up more space on the bench-top. I went for the first option even though it required more design work. My meter is wedged into the 4.5” by 2.7” box shown in Figure 3.
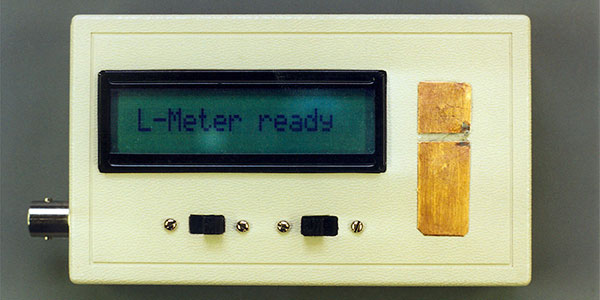
Figure 3. I decided not to spoil the meter’s elegant simplicity with clumsy labels. The display tells you that the meter is on and what mode it is in.
The display cut-out allows the bezel to protrude, letting the display board lie against the inner surface of the box and be glued to it with some silicone rubber. This leaves more height for the other components.
I filed the inner edges of the pillars which hold the box together to mount the LCD a little closer to the edge of the box. One edge of the LCD board protrudes into the battery compartment but doesn’t get in the way. This edge could be trimmed off if necessary. (You might be more comfortable using a larger box.)
The circuit board is mounted behind the display. My display had its connector pads in its top left corner. This dictated the layout of the front panel and the size of the circuit board. I had to bend some of my design rules to make things fit. Figure 4 shows the result.
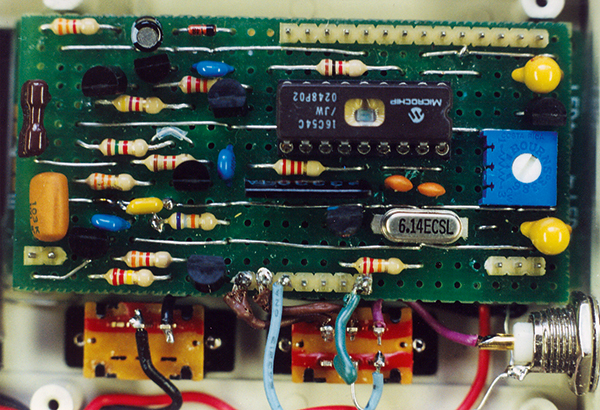
Figure 4. If the 1.5” by 2.9” circuit board is mounted directly on the display, the entire unit fits in a 2.7” by 4.5” project box.
The primary mechanical support for the board is the row of wire-wrap pins I soldered to it. They mate with a female connector soldered to the LCD. Soldering both ends of the pins is an alternative. Pins on the lower edge of the board add rigidity and, incidentally, couple the test pads and the battery to the board. Since only connector friction holds the board in place, I glued some foam draft-excluder tape to the bottom of the box to stop the board from working loose.
The contact pads for the inductor under test are a piece of very thin single-sided PC board glued to the front panel over the battery compartment. I cut away some of the insulating material with a dental drill to make invisible connections to the undersides of the pads. In the ideal world, the pads would be gold-plated and the battery would be shielded from the “live” pad to eliminate its stray capacitance.
Apart from the display, the only other front-panel features are the two slide switches. One turns the meter on and off, the other selects frequency or inductance mode. VR1, a trimmer on the PC board, sets the contrast of the LCD.
Board Construction
I rarely use printed circuits for prototypes, preferring perforated prototyping board with continuous copper strips on one side. I cut a board 1.5” by 2.9” with the copper strips parallel to the short side of the board. The strips are cut as necessary. Bus-wires are added on the component side before the components are inserted. This makes for a neat layout and is far easier than etching a custom printed circuit. Figure 5 shows the component side of the board. Pairs of short parallel lines indicate where a copper strip on the underside must be cut through. The thick horizontal lines represent bus wires. Diamonds show where these are soldered to the copper strips.
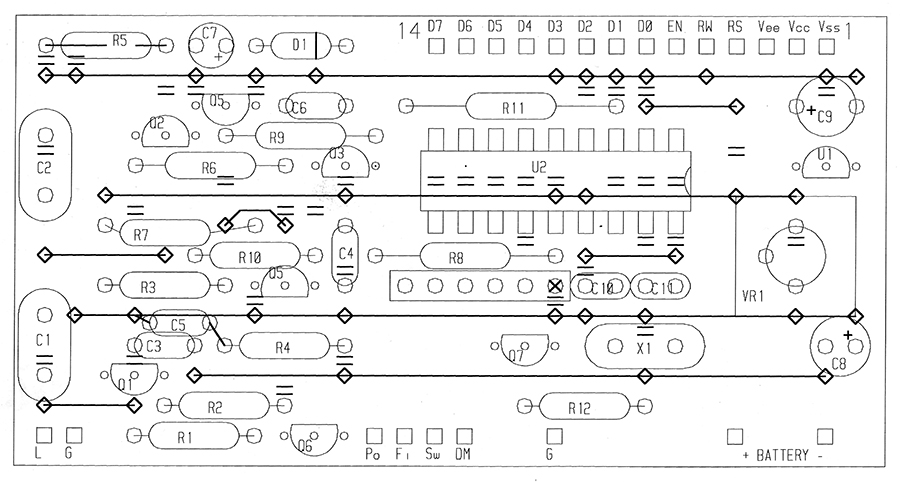
Figure 5.
Unfortunately, I couldn’t quite squeeze in all the components. C5 is wired between other components, the leads of R5 must be bent inwards before soldering, and R7 has to bend around a jumper wire.
Finding a Display
Two good sources of cheap displays are All Electronics (www.allelectronics.com) and Marlin P. Jones & Association (www.mpja.com). You need a one-line by 16-character display. The description may not specifically say “reflective,” but that’s the kind you want. If “transmissive” or “backlight” are mentioned, you’re looking at the wrong type, it won’t run from a battery.
No particular display is guaranteed to remain in stock. I used the LCD-75 from All Electronics but by the time you read this, they may have some other 16-character displays in stock. As these are around $5.00 each, you can probably afford to experiment.
Not all displays use the same pinout. The standard I’ve assumed is a 14-pin single row on a long edge of the board. One snag is that, in some displays, the connector pads run along the bottom edge of the board and in others, the top edge. Often you can’t tell which is which without powering up the display. The one I bought had its connector above the display even though the lettering on the PC board implied that the display should be mounted the other way up.
Check which pad is number 1. It’s the ground pad and is connected to the bezel of the display. If it’s at the “wrong” end of the row, the meter board must be mounted upside-down to make the pins match. Reflective displays sometimes come with two extra pads (15 and 16) to drive the non-existent backlight. These can be ignored.
The other common connector standard is a double row of pads on the short edge. This makes for a convenient ribbon cable interface but such a display would be too long to fit the box.
In my experience, 16-character, single-line displays behave electrically as if they were eight-character, two-line displays. That is, they use two separate sections of display memory to store the first and second eight-character block. (This minimizes driver chips.) The PIC firmware takes this into account but offers the option of writing all 16 characters to a single block, letting you use one line of a two-line display as your output device. A jumper wire between the pins labelled DM and G in Figure 5 sets this mode of operation.
Calibration
The relationship between the oscillator frequency and the displayed inductance is controlled by a calibration constant stored as three RET N instructions at code addresses 1, 2, and 3. The default value is 277,578 which corresponds to a tuning capacitance of 1,315 pF (C1, C2 and 11 pF of stray capacitance). If the strays are significantly higher, or if you measure large air-cored inductors with a high self-capacitance, the oscillator frequency will be lower than it should be and the meter will read high. If, when measuring accurately-known inductors, you get readings more than a percent or two in error, you might consider changing the calibration constant. If your meter gives consistently low inductance readings, this can be corrected by adding a 30 pF trimmer across the 1,500 pF capacitor.
This meter measures inductance under small-signal conditions. It has no mechanism for measuring how core saturation affects the inductance at high operating currents. Saturation is an important factor in DC-DC converter design.
Pleased as L
After years of fumbling with capacitors and signal generators, it’s extremely gratifying to be able to touch any old inductor to the contact pads and have the meter tell me its value. I hope you’ll find it as useful as I do. NV
Parts List
| U1 |
79L05 |
Negative voltage regulator |
| U2 |
PIC16C54C/JW |
See sidebar |
| |
| Q1, Q3, Q6, Q7 |
NPN transistor, 2N3904 |
|
| Q2, Q4, Q5 |
PNP transistor, 2N3906 |
|
| D1 |
Small signal diode, 1N4448 or similar |
|
| X1 |
6.144 MHz crystal |
|
| |
| All resistors 5%, 0.25W |
|
|
| R1 |
220K |
|
| R2 |
3.3K |
|
| R3 |
33K |
|
| R4 |
68K |
|
| R5 |
3.3K |
|
| R6 |
4.7K |
|
| R7 |
1.5K |
|
| R8 |
2.2K |
|
| R9 |
22K |
|
| R10 |
1.2K |
|
| 11R |
1.0K |
|
| R12 |
22K |
|
| |
| VR1 |
10K trimmer |
|
| SIP |
Six-pin 33K, common connection to pin 1 |
|
| |
| C1 |
0.01 µF 5%, plastic foil |
|
| C2 |
1500 pF 1%, mica or plastic foil |
|
| C3, C4, C5, C6 |
0, 1 µF 20%, ceramic |
|
| C7 |
10 µF 16V, electrolytic |
|
| C8, C9 |
15 µF 20V, tantalum bead |
|
| C10, C11 |
33 pF, ceramic |
|
| |
| SW1 |
On/Off slide switch |
|
| SW2 |
Two-pole, two-way slide switch |
|
| |
| LCD |
One line by 16 character reflective display |
|
| |
| Plastic project box |
| Prototyping board |
|
| Male and female single line connectors |
| BNC connector |
About the Author
Tom Napier formerly worked for space and high-energy physics research organizations in Europe. Since 1982, he has developed innovative electronic equipment for companies in the US. He is now an electronics consultant based in SE Pennsylvania.
Downloads
Microcontroller/PIC 2005-08 (figure 5 and an object file)
